Select the budget you want. "Adopted" budgets are the budgets passed by the county / school board. "Actual" budgets are
the actual spending and revenue figures that occurred. "Proposed" budgets, if available, are not yet passed by the county / school board.
This option is available for some tables. This allows you to compare the same items / departments across multiple years. This is optional.
For county spending, type in your taxes and the site will compute the approximate amount of your money that goes toward a particular item or department and display it when
hovering your mouse over that item or department. This information is neither required nor saved.
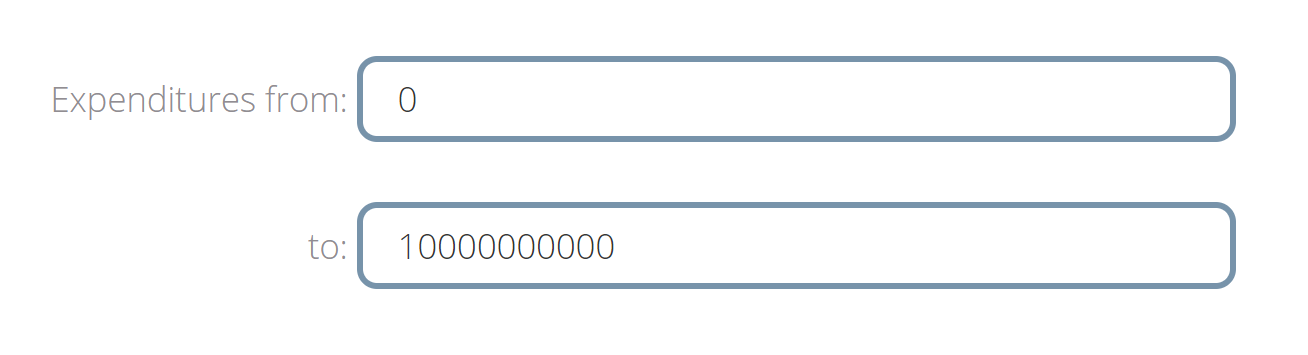
On some of the budget-related tables, you can select a range of expenditures or revenues to include in the table. By default, the table includes all items
between $0 and $10 billion, inclusive. Just change the lower or upper value to exclude or include budget items. For example, there are a few budget
items that are negative, so changing 0 to a negative number will include those items.
The Capital Improvement Plan (CIP) covers 10 years; use this option to select which year you want to display (or all of them).
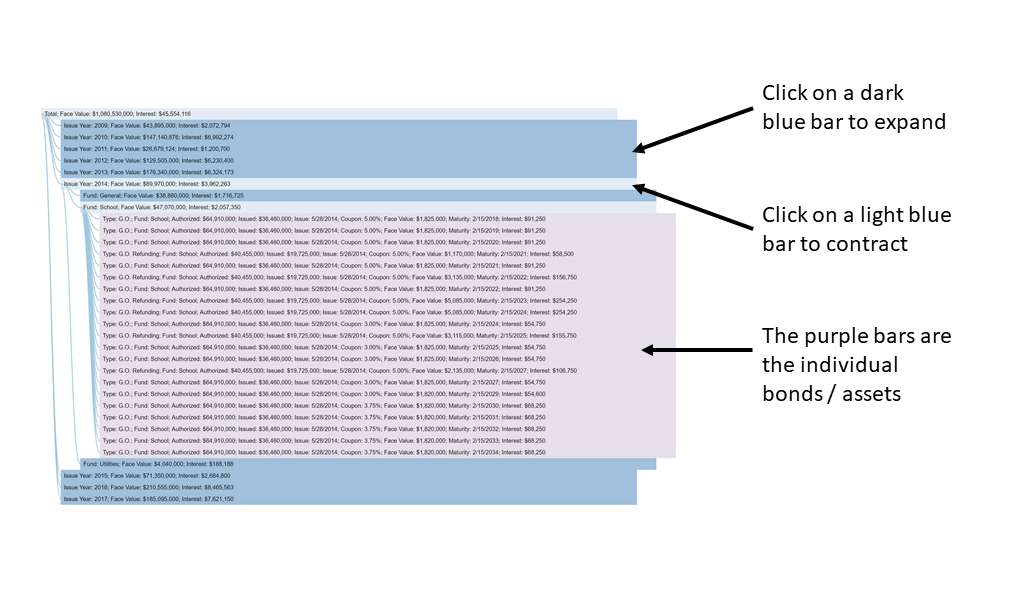
When visualizing Arlington's bonds, select "sort by maturity year" (when the bond is due) or "sort by issue year" (when the bond was issued). Showing the bonds by maturities
shows what Arlington will owe going forward, showing by issue year helps identify trends in borrowing.
When looking at school statistics, pick the type of statistic and the type of school to display in the table. Make a new selection, and the table will refresh with the appropriate data.
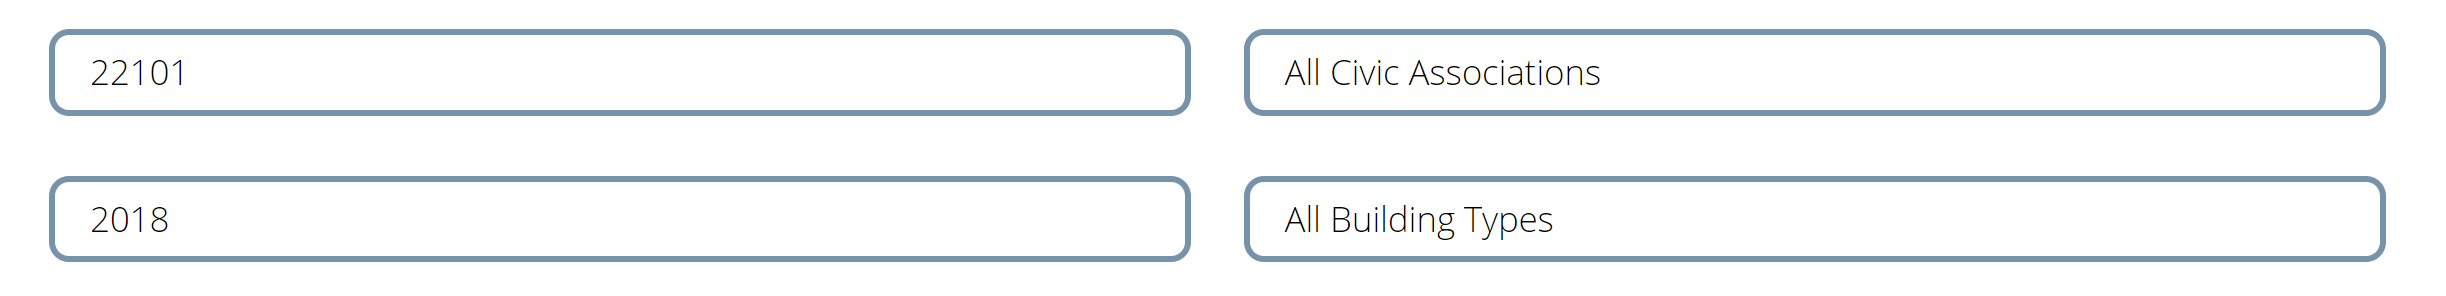
For assessments, there are four options. In the upper left, select the zip code for the properties you want to view. Select "all" for the entire county, although this can be a
bit slow, especially if the list includes all building types. In the upper right, select the civic association's properties. Note that the properties displayed at members of
both the civic association *and* the zip code; so if you pick a civic association like Arlingwood and a zip code like 22202, there won't be any properties displayed. In the lower
left, select the year assessments to show. The table only shows one year of assessments at a time. In the bottom right, pick the type of building displayed. Selecting an option with
a single digit and multiple dashes, such as "1---Office Buildings" will return all categories that begin with 1, in this case 100, 101, 110, 111, and 112.

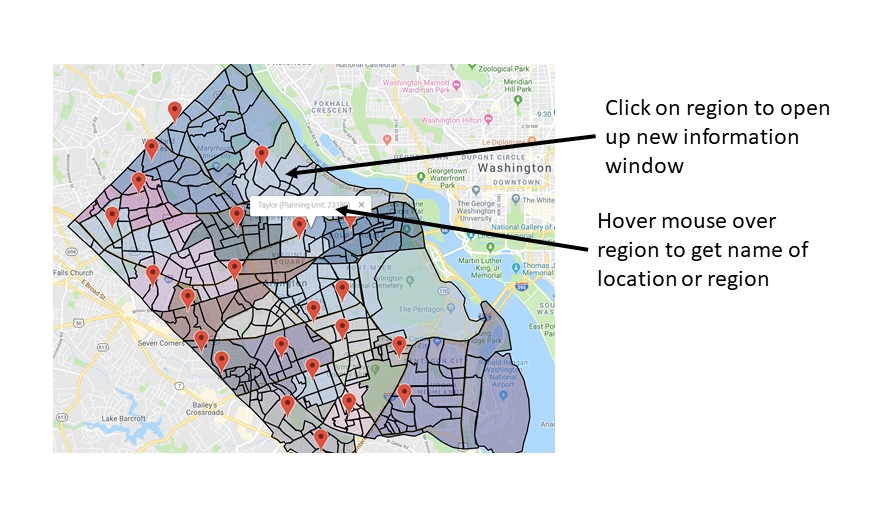
The left selection is for the civic association for which you want to generate the report. All reports are "geo-located" with a latitude and longitude, which are cross-referenced
with the civic associations to see whether the coordinates are located within the civic association boundaries. About 90 percent of
incidents are associated are located within a civic association boundary; the remaining 10 percent are in locations not associated with a civic association, such as the Pentagon, or
are errors. The middle selection is the month. The right selection is the year. If the report does not exist for the year / month combination selected, the table will not update
to your selection.

Tables come with the option to export the data. For those who want to play with the data themselves or use the reports, these tools are available to quickly
retrieve the data in your favorite format. "Copy" copies the data to the clipboard, "CSV" saves the data as a comma-separated value file, "Excel" saves the data
to an Excel file, PDF saves the table to a PDF file, and print formats the table for printing.